30-01 November/December 2006
Winter Storm Chase
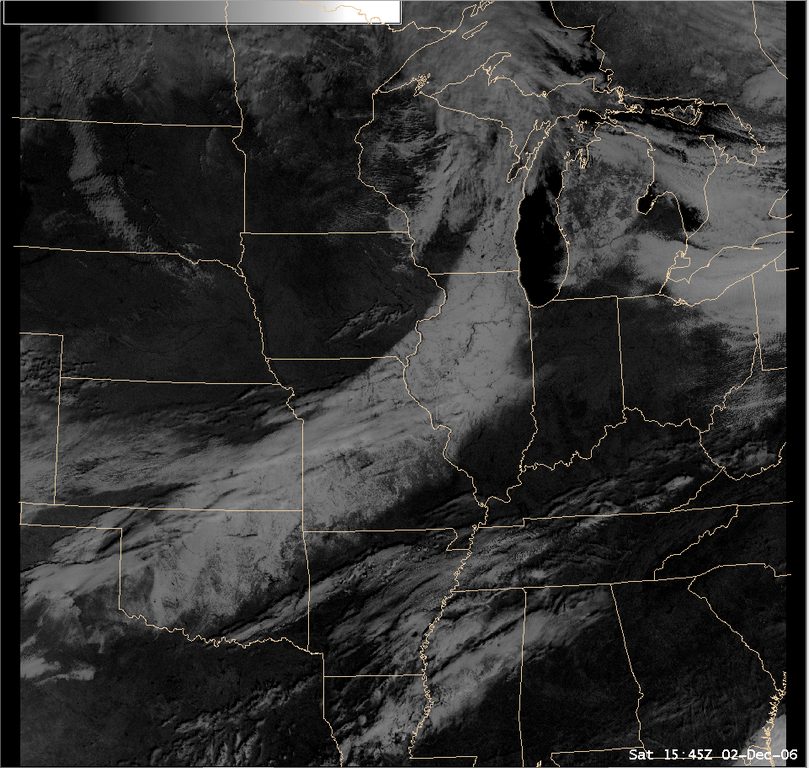
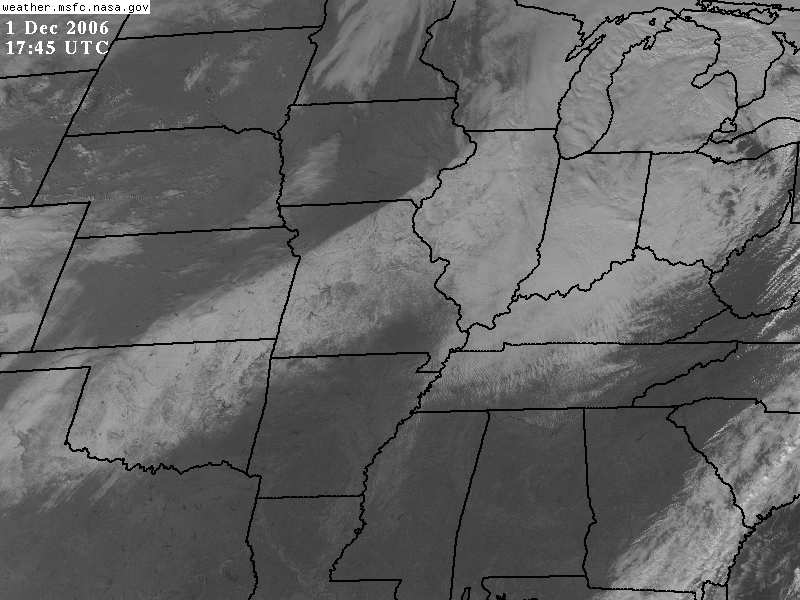
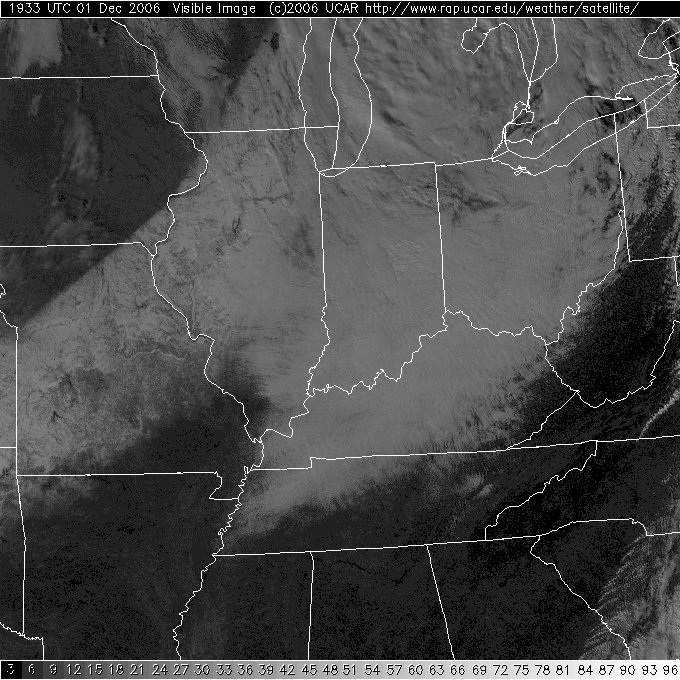
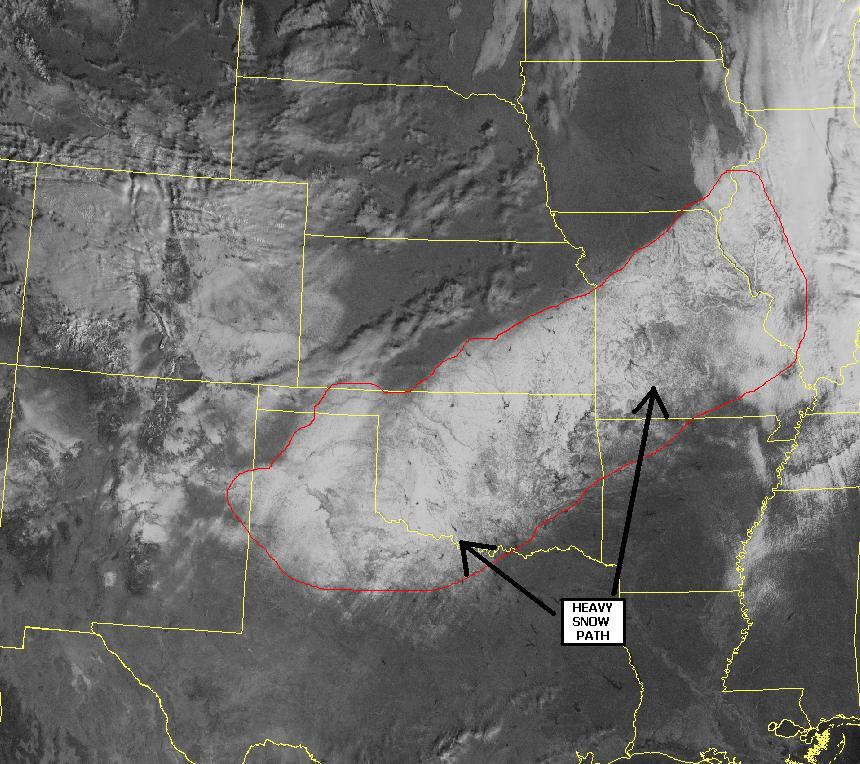
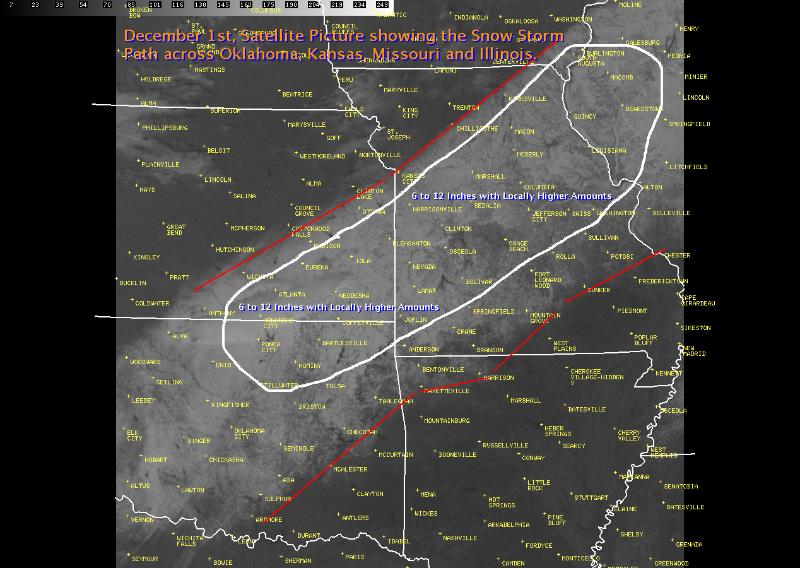
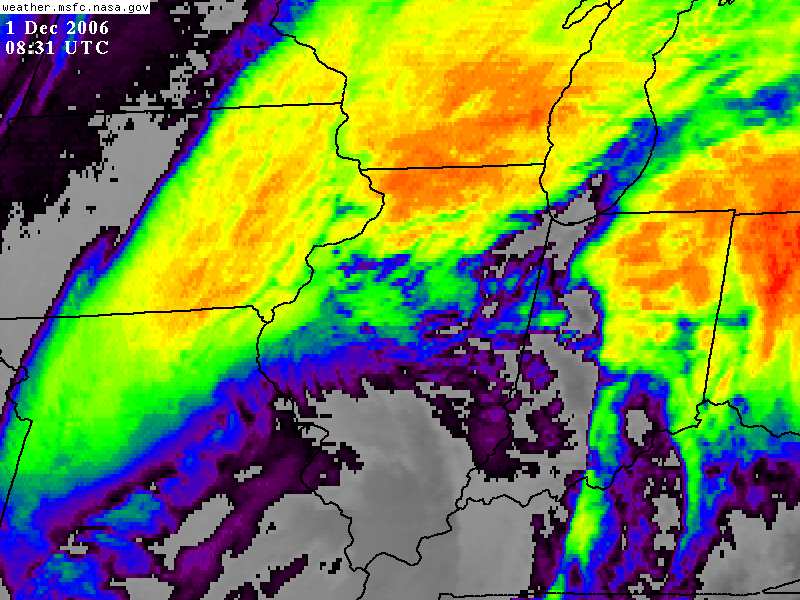
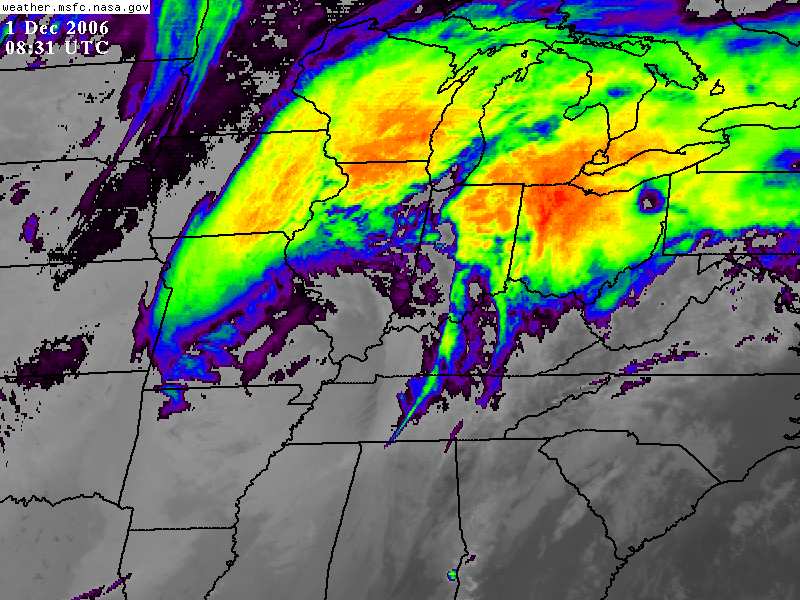
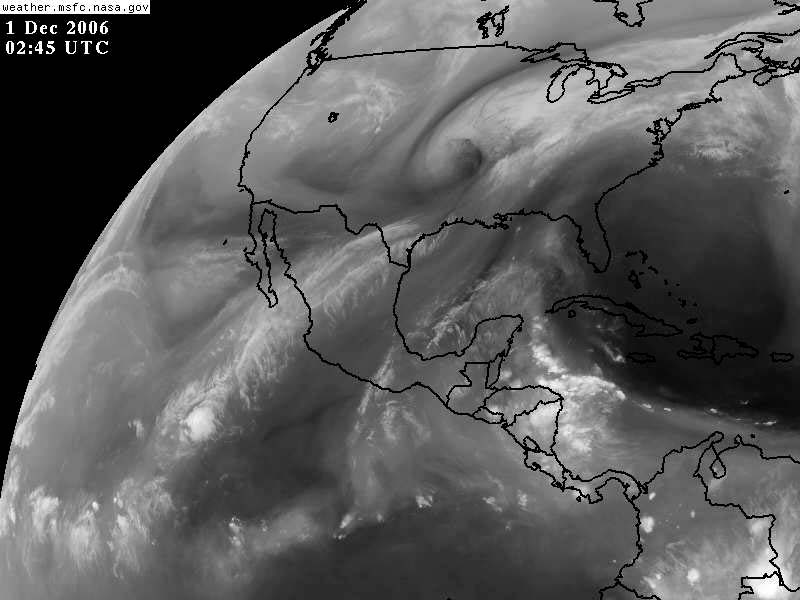
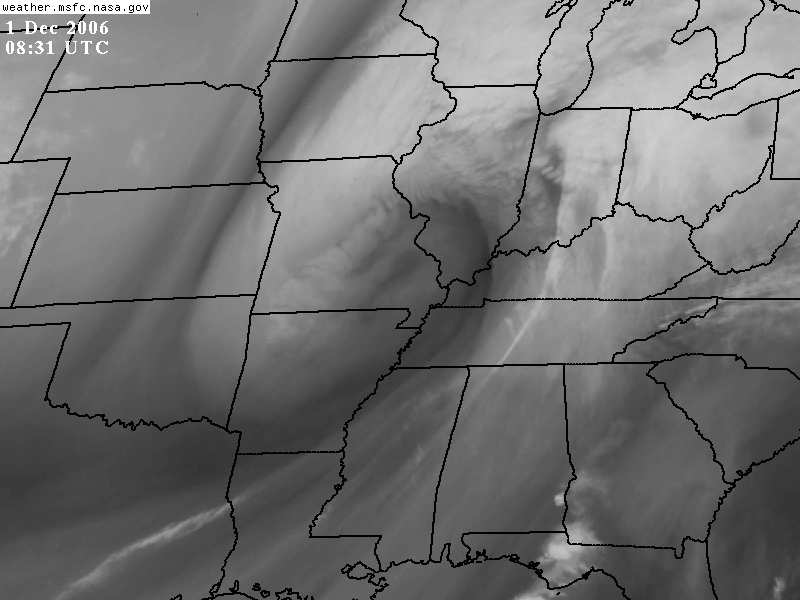
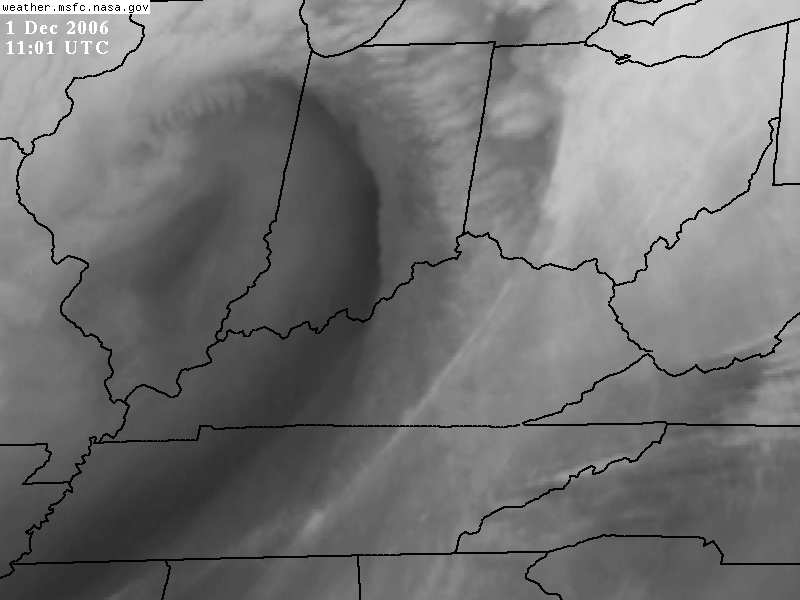
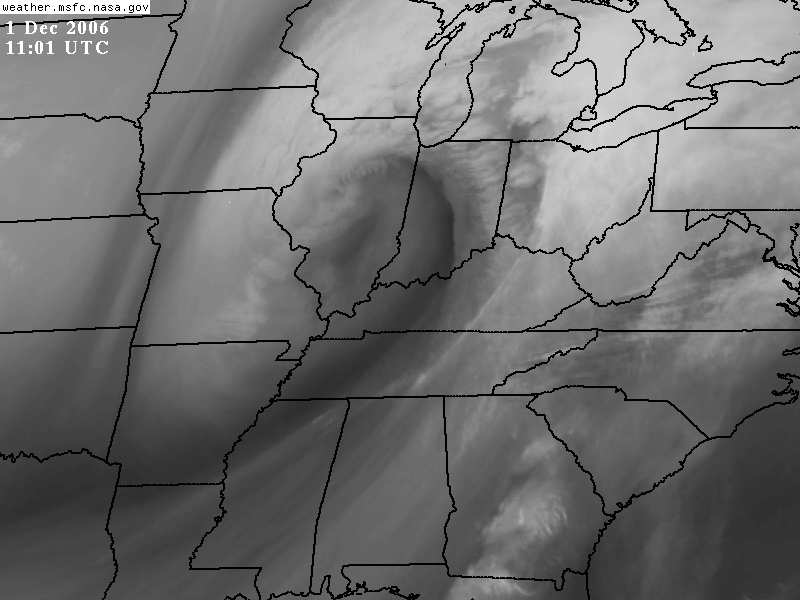
General Storm Evolution | Daily Highlights | Snowfall Total Maps | Satellite Imagery
Wednesday | Thursday | Friday |
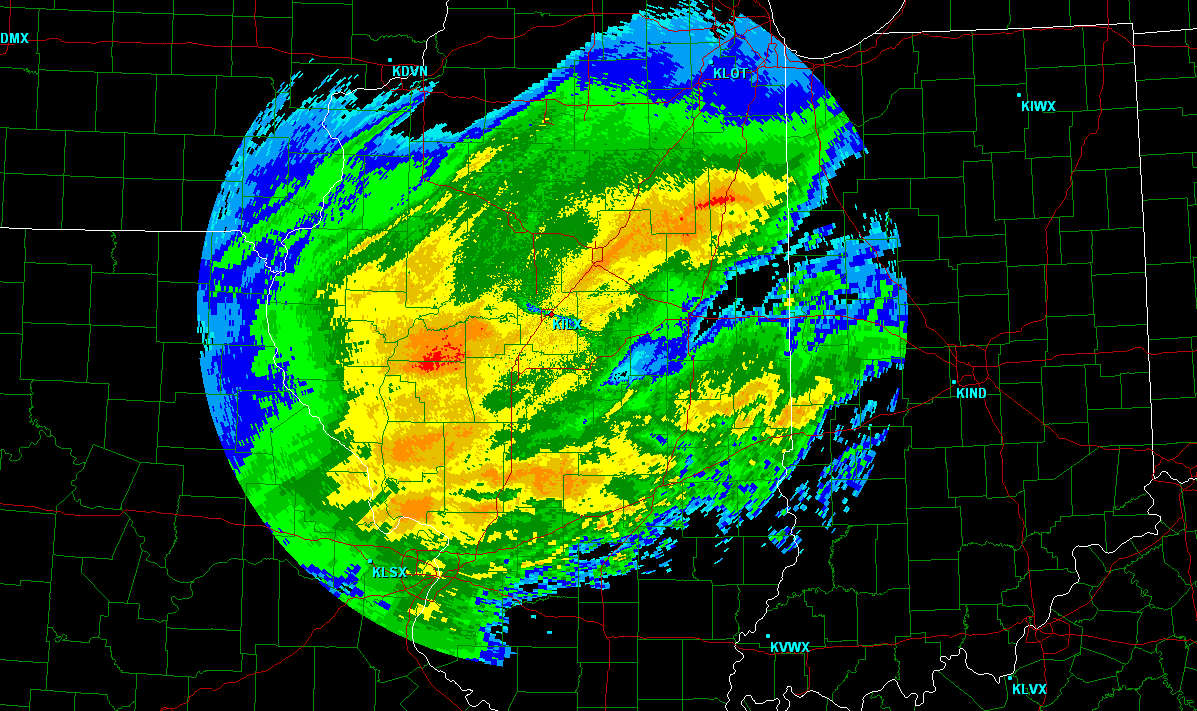
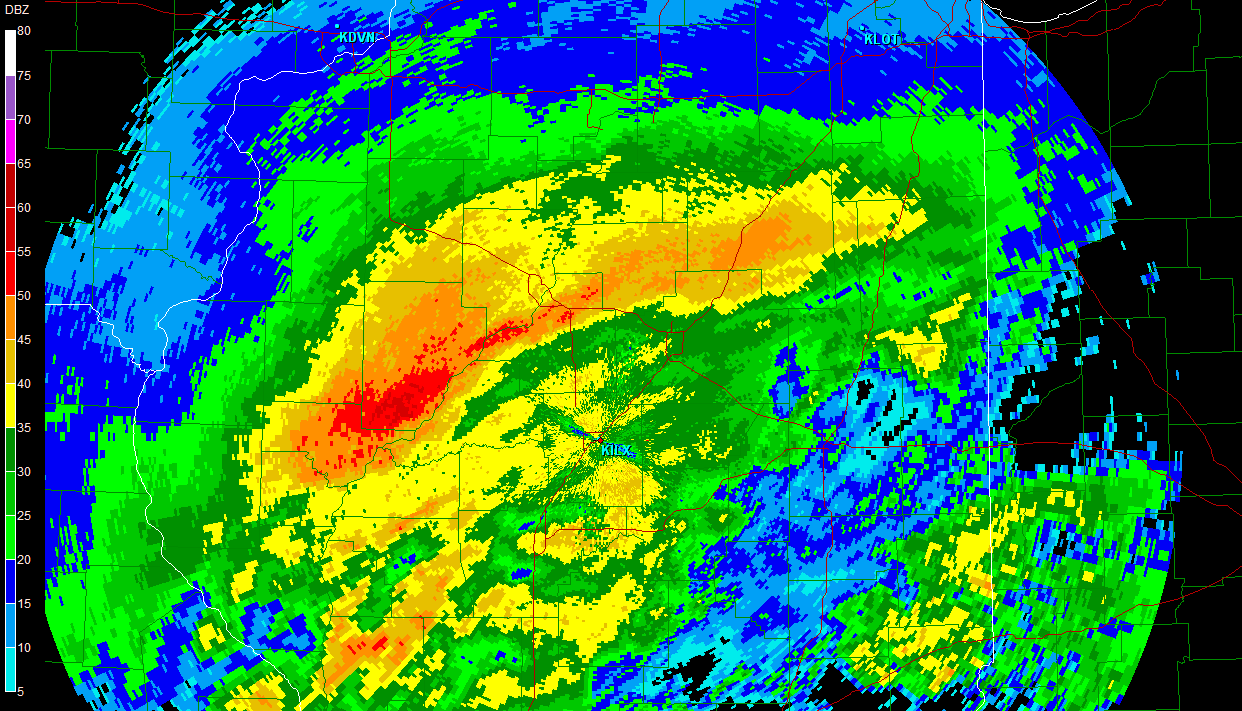
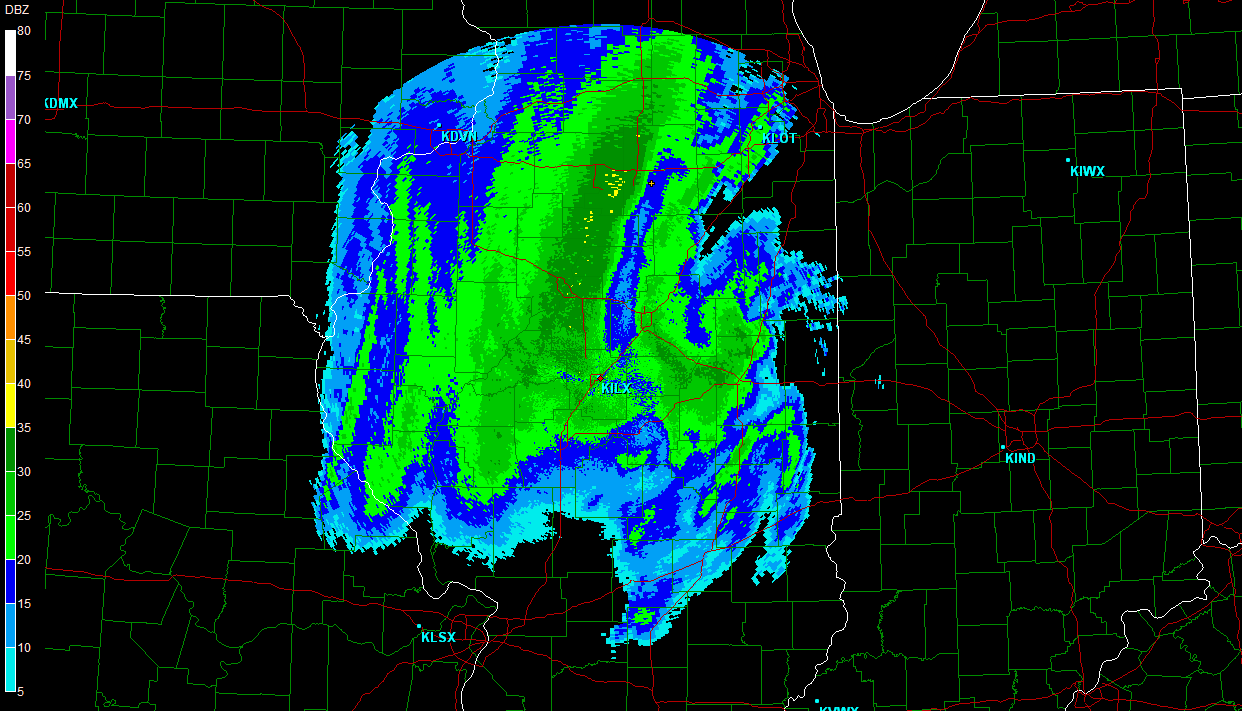
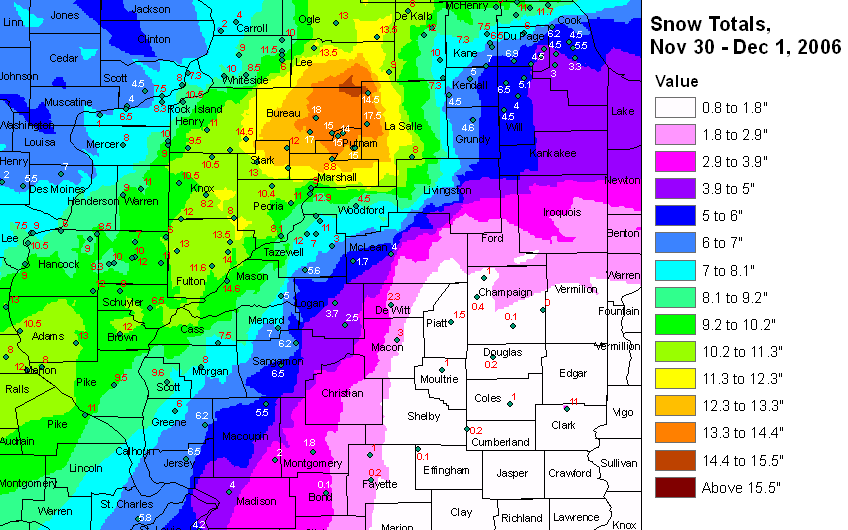
Eastern United States Composite Radar |
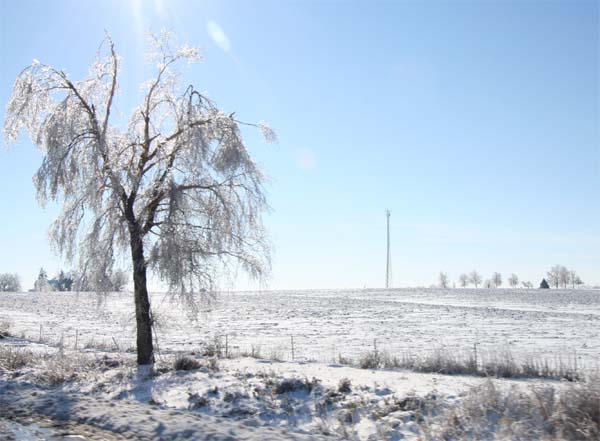
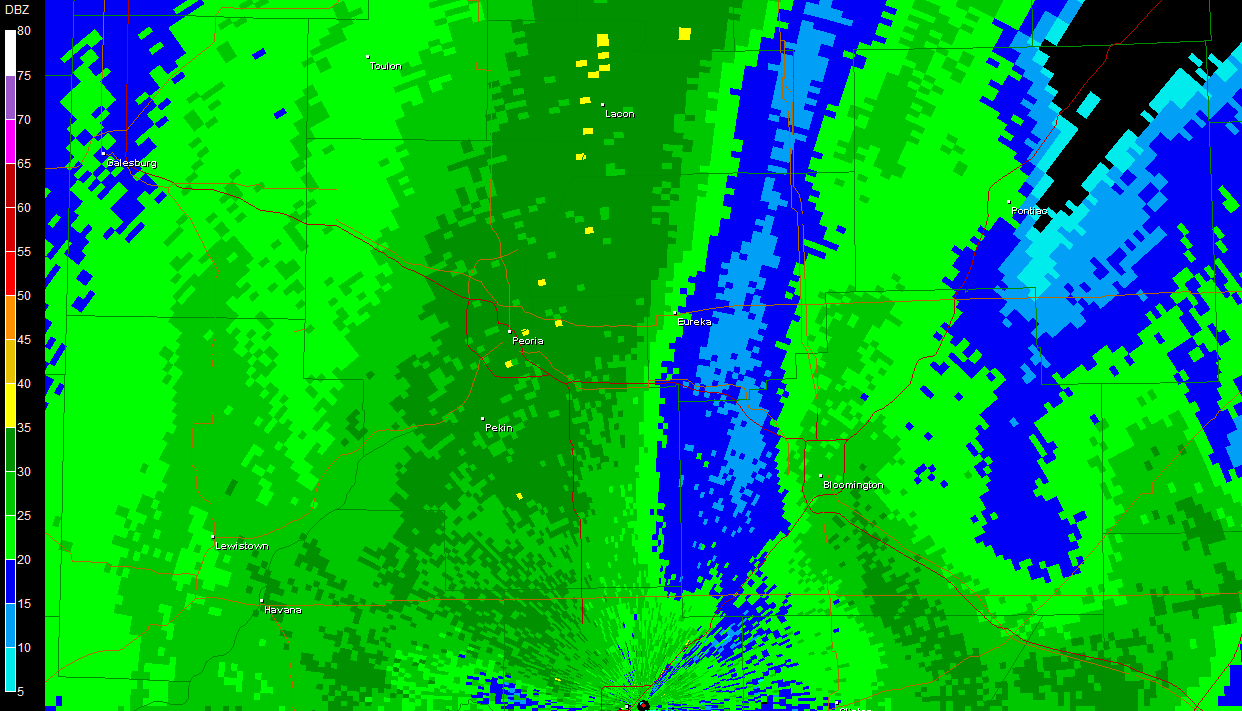
Central Illinois Heavy Ice Accumulation |
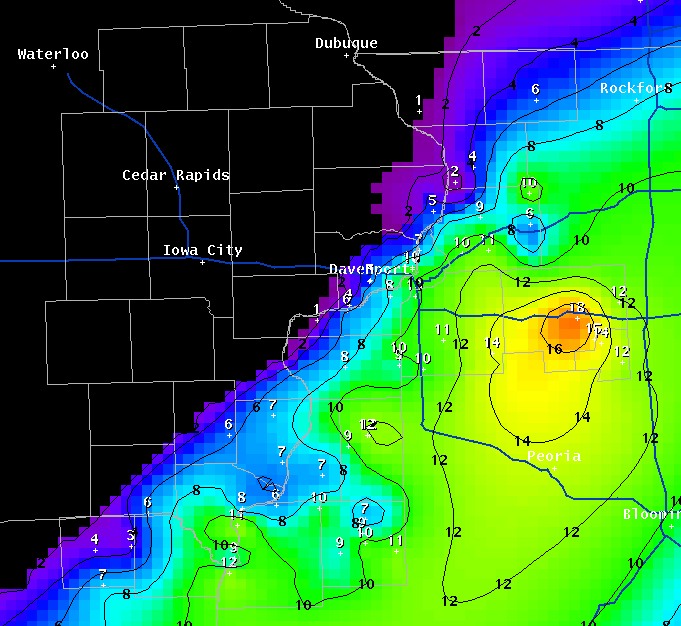
Chase Target: Peoria, Illinois
Arrival Date: November 30th at 2:30 a.m.
Driving Time: 5 1/2 Hours
Chase Rating ![]()
![]()
![]()
![]()
![]()


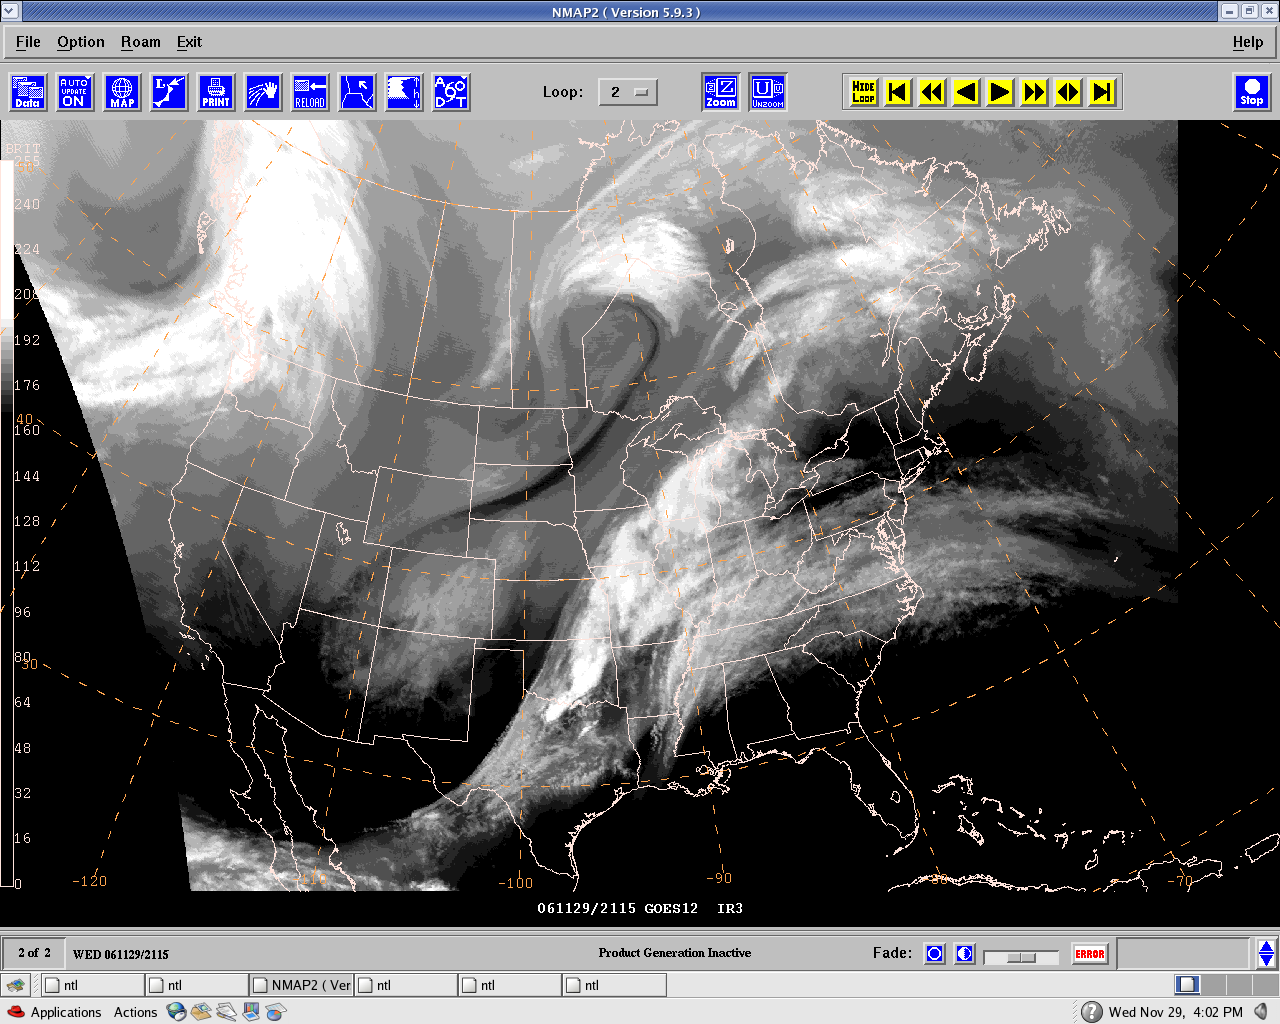


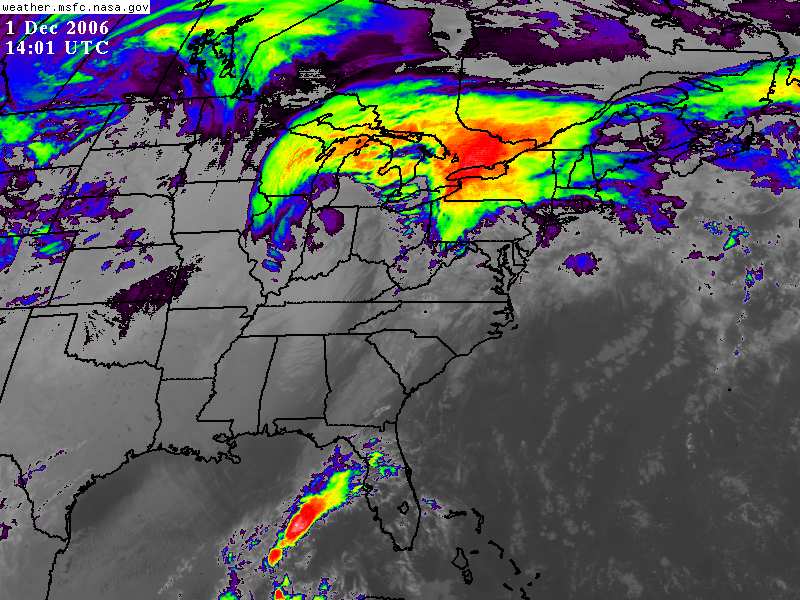

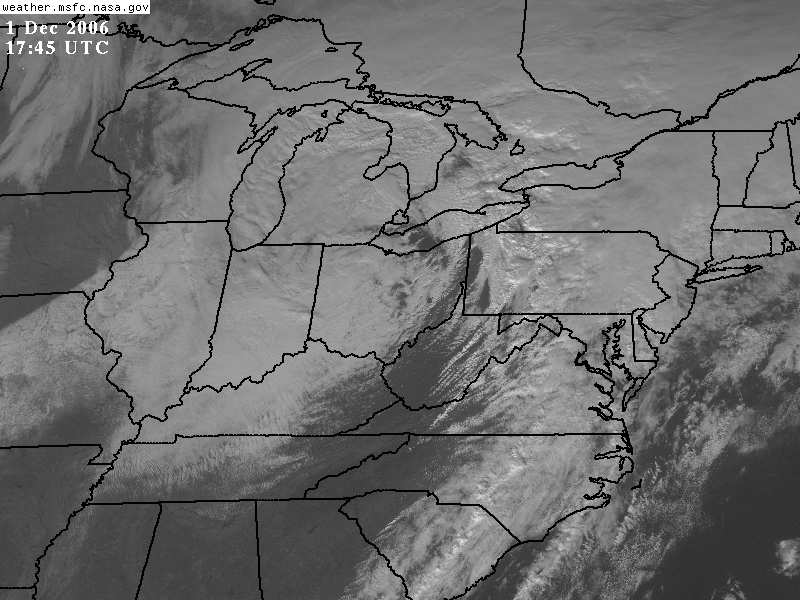
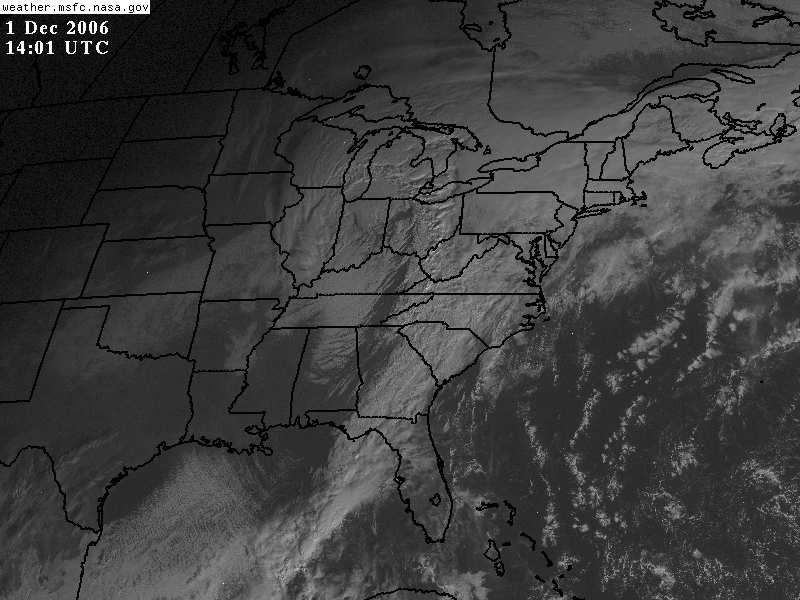
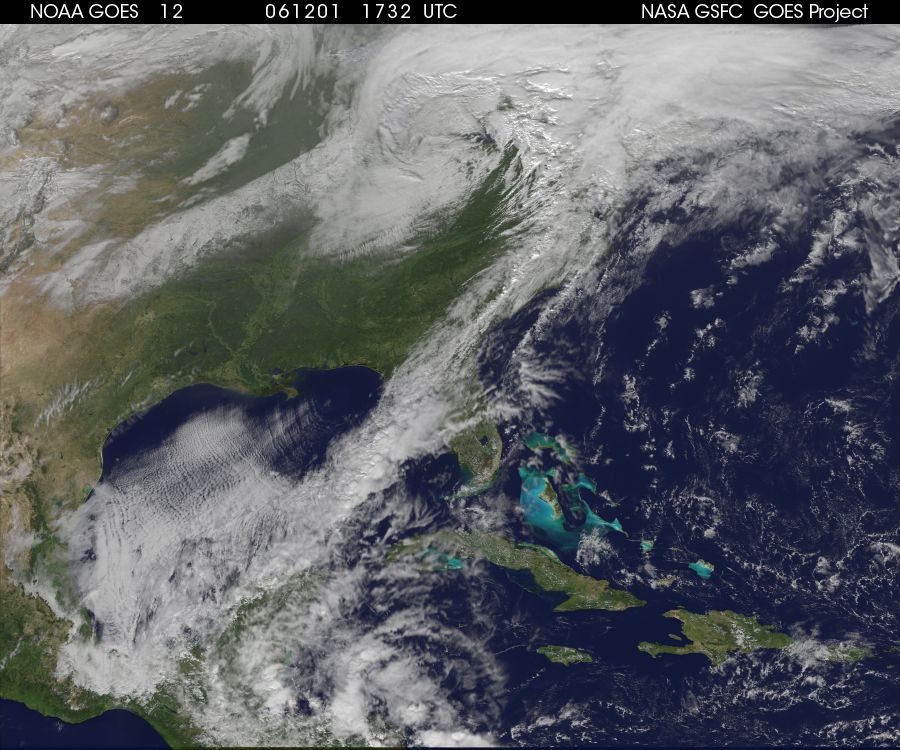
.jpg)